| 4Q and Full Year 2021 ResultsMarch 14, 2022 NASDAQ: IONM |
| Cautionary Note regarding Forward‐Looking StatementsThis presentation may contain “forward‐looking statements” within the meaning of applicable securities laws. Forward‐looking statements may generally be identified by the use of the words "anticipates," "expects," "intends," "plans," "should," "could," "would," "may," "will," "believes," "estimates," "potential," "target," or "continue" and variations or similar expressions. Forward‐looking statements include, but are not limited to, statements regarding forecasts of managed cases and remote neurology managed cases, the potential for accretive M&A work, potential margin improvement with scale in remote neurology services, lower costs of delivery and improved quality of services from remote neurology services, potential for expansion into adjacent markets, targeted states for growth, and expansion opportunities. These statements are based upon the current expectations and beliefs of management and are subject to certain risks and uncertainties that could cause actual results to differ materially from those described in the forward‐looking statements. Theserisks include risks regarding our patient volume or cases not growing as expected, or decreasing, which could impact revenue and profitability; unfavorable economic conditions could have an adverse effect on our business; risks relatedtoincreased leverage resulting from incurring additional debt; the policies of health insurance carriers may affect the amount of revenue we receive; our ability to successfully market and sell our products and services; we may be subject to competition and technological risk which may impact the price and amount of services we can sell and the nature of services we can provide; regulatory changes that are unfavorable in the states where our operations are conducted or concentrated; our ability to comply and the cost of compliance with extensive existing regulation and any changes or amendments thereto; changes within the medical industry and third‐party reimbursement policies and our estimates of associated timing and costs with the same; our ability to adequately forecast expansion and the Company’s management of anticipated growth; and risks and uncertainties discussed in our most recent annual and quarterly reports filed with the United States Securities and Exchange Commission, including our annual report on Form 10‐K filed on March 14, 2021, and with the Canadian securities regulators and available on the Company’s profiles on EDGAR at www.sec.govand SEDAR atwww.sedar.com, which risks and uncertainties are incorporated herein by reference. Readers are cautioned not to place undue reliance on forward‐looking statements. Except as required by law, Assure does not intend, and undertakes no obligation, to update any forward‐looking statements to reflect, in particular, new information or future events.Non‐GAAP Financial MeasuresThis presentation includes certain measures which have not been prepared in accordance with Generally Accepted Accounting Principals (“GAAP”) such as Adjusted EBITDA. We define EBITDA as net income/(loss) before interest expense, provision for income taxes, depreciation and amortization. We calculate Adjusted EBITDA as EBITDA further adjusted to excludethe effects of the following items: share‐based compensation, gain on payroll protection program loan and gain on extinguishment of acquisition debt. We exclude share‐based compensation because this represents a non‐cash charge and our mix of cash and share‐based compensation may differ from other companies, which effects the comparability of results of operations and liquidity. We exclude gain on payroll protection program loan and gain on extinguishment of acquisition debt because these are non‐recurring items and we believe their inclusion is not representative of operating performance. Adjusted EBITDA is not an earnings measure recognized by GAAP and does not have a standardized meaning prescribed by GAAP. Management believes that Adjusted EBITDA is an appropriate measure in evaluating the Company’s operating performance. Management uses Adjusted EBITDA to evaluate our ongoing operations and for internal planningand forecasting purposes. Management believes that non‐GAAP financial information, when taken collectively, may be helpful to investors because it provides consistency and comparability with past financial performance. Readers are cautioned that Adjusted EBITDA should not be construed as an alternative to net income (as determined under GAAP), as an indicator of financial performance or to cash flow from operating activities (as determined under GAAP) orasa measure of liquidity and cash flow. Investors are cautioned that there are material limitations associated with the use of non‐GAAP financial measures as an analytical tool. Other companies, including companies in our industry, may calculate similarly titled non‐GAAP measures differently or may use other measures to evaluate their performance, all of which could reduce the usefulness of our non‐GAAP financial measures as tools for comparison. We attempt to compensate for these limitations by providing specific information regarding the GAAP items excluded from these non‐GAAP financial measures. Investors are encouraged to review the related GAAP financial measures and the reconciliation of these non‐GAAP financial measures to their most directly comparable GAAP financial measures presented on slide and not rely on any single financial measure to evaluate our business.Key Performance MetricsThis presentation contains key performance metrics that management of the Company utilizes to determine operational performance from period to period. These metrics include managed cases and remote neurology managed cases. We define managed cases as all technical cases Assure performs and any cases where the professional bill is from a 100% owned Assure entity and excludes cases when a global bill is presented and we calculate it based on bills presented during the relevant measurement period. We define remote neurology managed cases as a subset of managed cases where Assure’s remote neurology platform is utilized and billed. Management believes that managed cases and remote neurology managed cases are important measures of the Company’s operational performance because it is a consistent measurement to evaluatepatient revenue streams. Disclaimer & Safe HarborAssure Neuromonitoring | 2 |
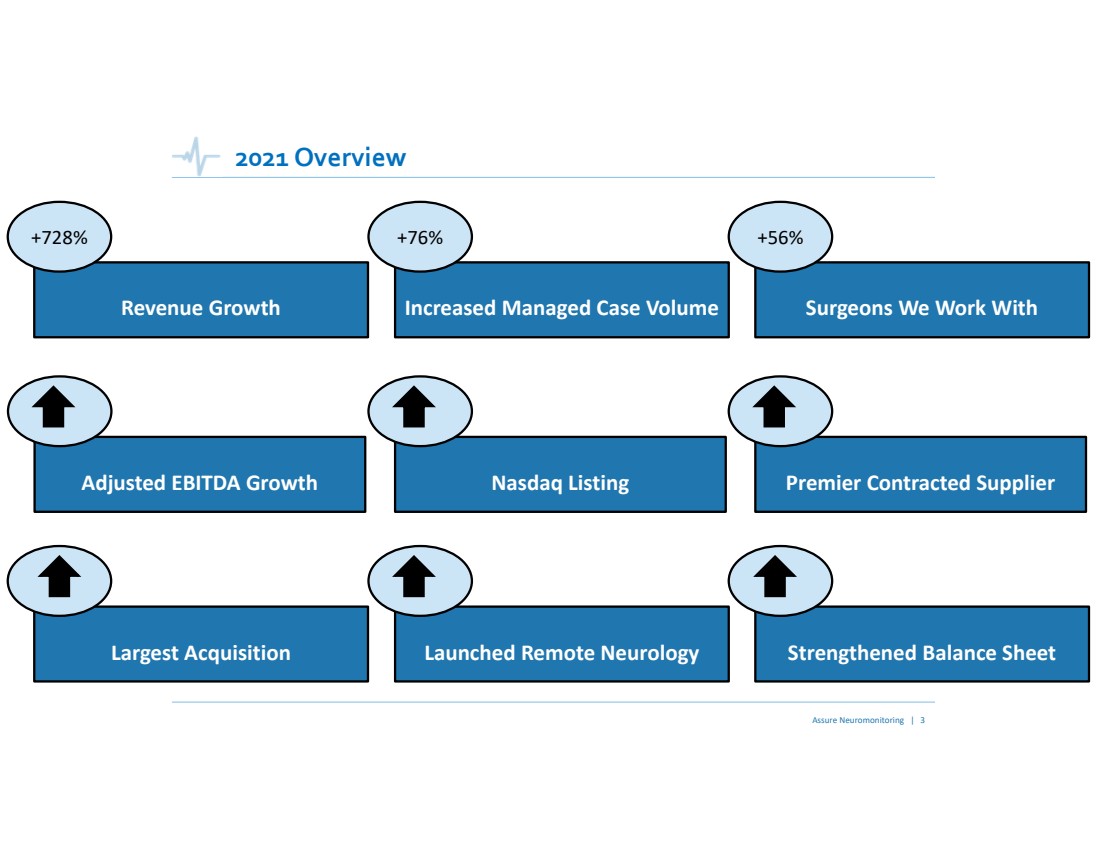
| 2021 Overview Assure Neuromonitoring | 3 Revenue Growth +728% Increased Managed Case Volume +76% Surgeons We Work With +56% Adjusted EBITDA Growth Nasdaq Listing Premier Contracted Supplier Largest Acquisition Launched Remote Neurology Strengthened Balance Sheet |
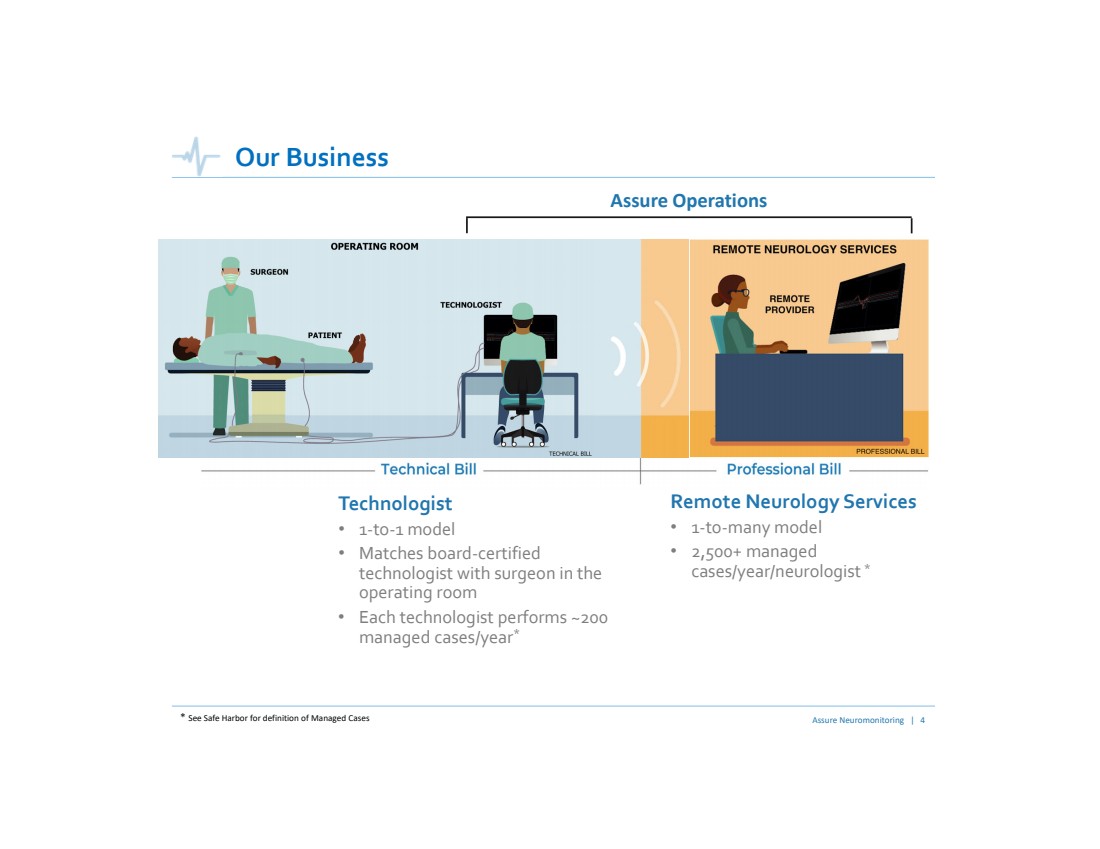
| Assure Neuromonitoring | 4 Our Business Remote Neurology Services•1‐to‐many model •2,500+ managed cases/year/neurologist* Assure Operations Technologist•1‐to‐1 model •Matches board‐certified technologist with surgeon in the operating room•Each technologist performs ~200 managed cases/year* * See Safe Harbor for definition of Managed Cases |
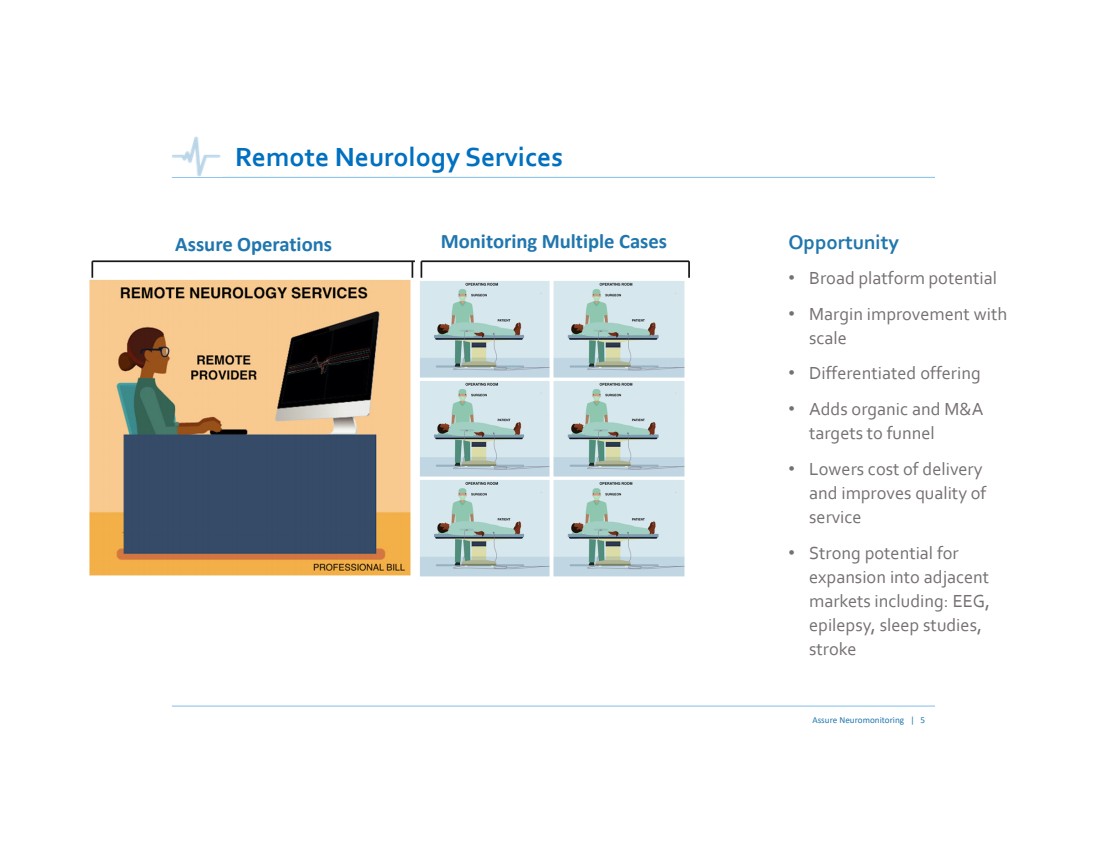
| Assure Neuromonitoring | 5 Remote Neurology ServicesOpportunity•Broad platform potential•Margin improvement with scale•Differentiated offering•Adds organic and M&A targets to funnel•Lowers cost of delivery and improves quality of service•Strong potential for expansion into adjacent markets including: EEG, epilepsy, sleep studies, stroke Assure Operations Monitoring Multiple Cases |
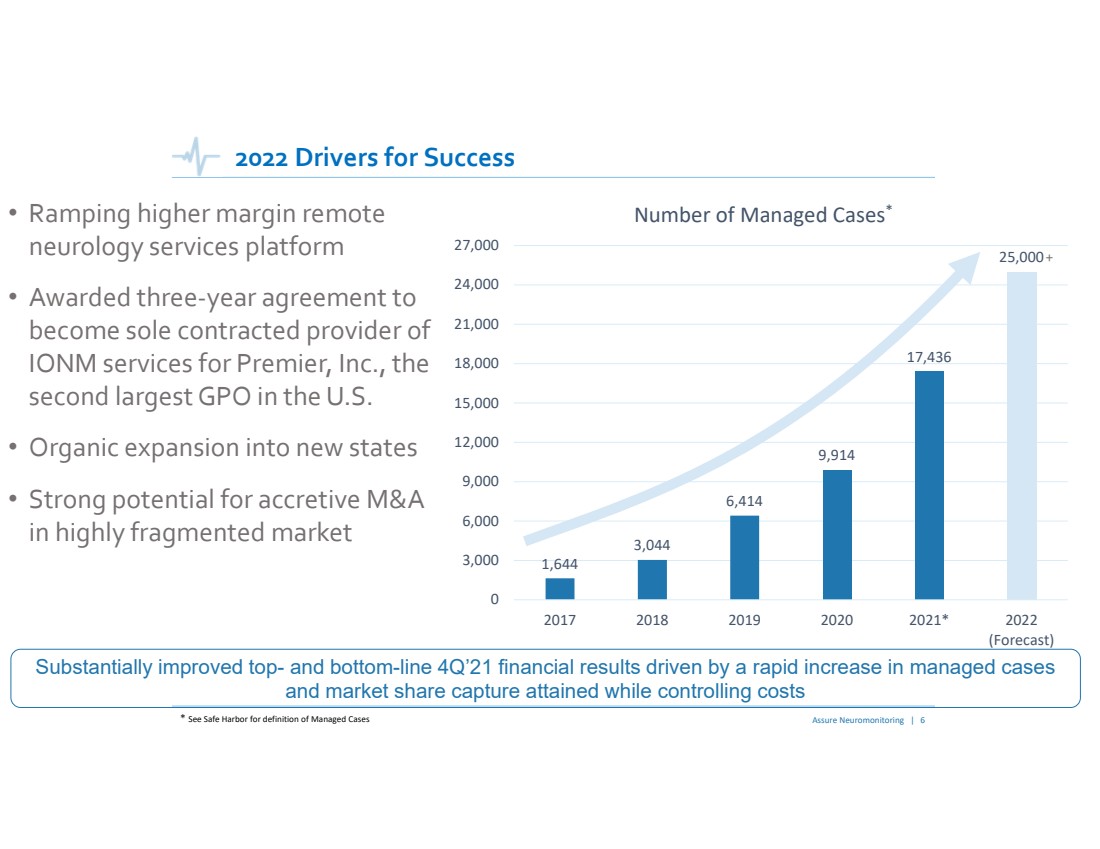
| Assure Neuromonitoring | 6 2022 Drivers for Success•Ramping higher margin remote neurology services platform•Awarded three‐year agreement to become sole contracted provider of IONM services for Premier, Inc., the second largest GPO in the U.S.•Organic expansion into new states•Strong potential for accretive M&A in highly fragmented market 1,6443,0446,4149,91417,43625,00003,000 6,000 9,00012,000 15,00018,00021,000 24,000 27,00020172018201920202021*2022(Forecast)Number of Managed Cases* Substantially improved top-and bottom-line 4Q’21 financial results driven by a rapid increase in managed cases and market share capture attained while controlling costs +* See Safe Harbor for definition of Managed Cases |
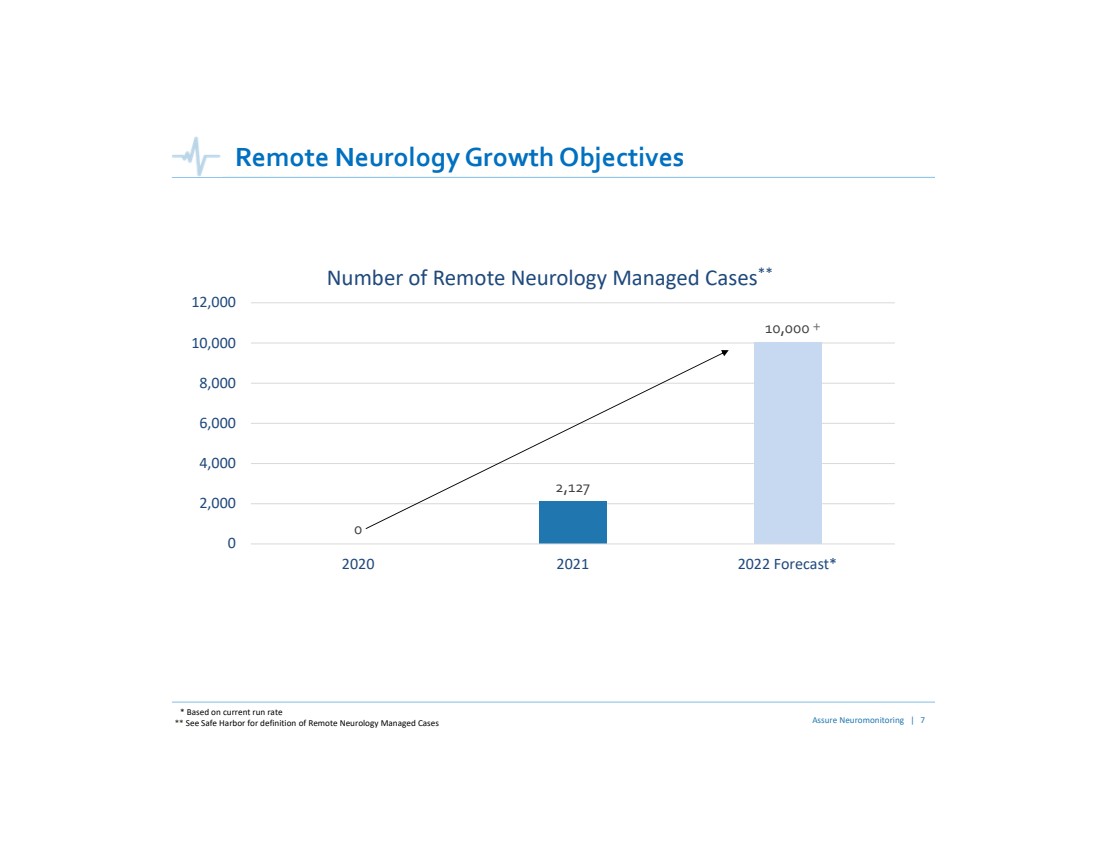
| Remote Neurology Growth Objectives * Based on current run rate 02,12710,00002,0004,0006,000 8,00010,000 12,000202020212022 Forecast*Number of Remote Neurology Managed Cases** Assure Neuromonitoring | 7** See Safe Harbor for definition of Remote Neurology Managed Cases+ |
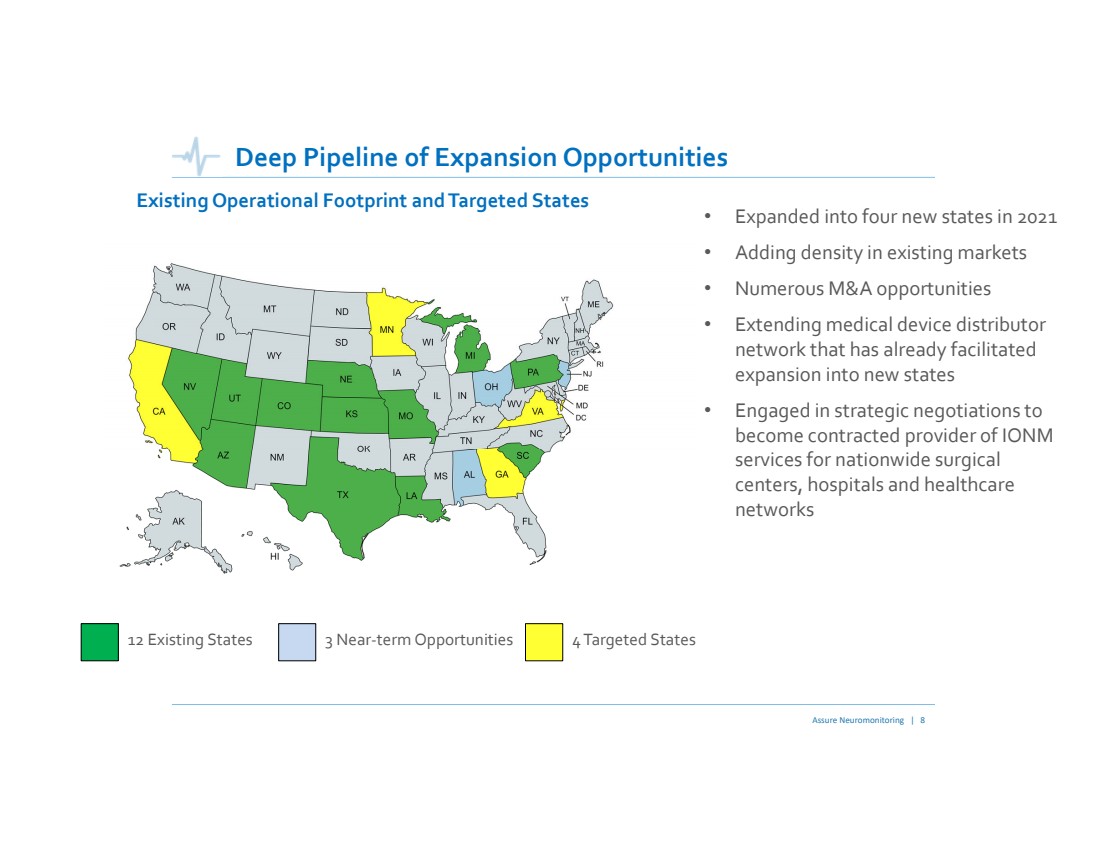
| Deep Pipeline of Expansion OpportunitiesExisting Operational Footprint and Targeted States•Expanded into four new states in 2021•Adding density in existing markets•Numerous M&A opportunities•Extending medical device distributor network that has already facilitated expansion into new states•Engaged in strategic negotiations to become contracted provider of IONM services for nationwide surgical centers, hospitals and healthcare networks Assure Neuromonitoring | 8 12 Existing States 4Targeted States 3 Near‐term Opportunities |
| Sole Contracted Supplier of IONM Services for Premier, Inc. Assure Neuromonitoring | 9 Premier is the second largest Group Purchasing Organization in the U.S., uniting an alliance of more than 4,400 hospitals and approximately 225,000 other providers•Assure was awarded a 3‐year agreement to become the sole contracted provider of IONM services for the Premier network•Assure competed in a competitive RFP process to win the Premier agreement•Assure’s selection was based on superior clinical care, quality of service, competitive pricing, as well as recognition that it has capacity to scale and support coverage for a large national GPO |
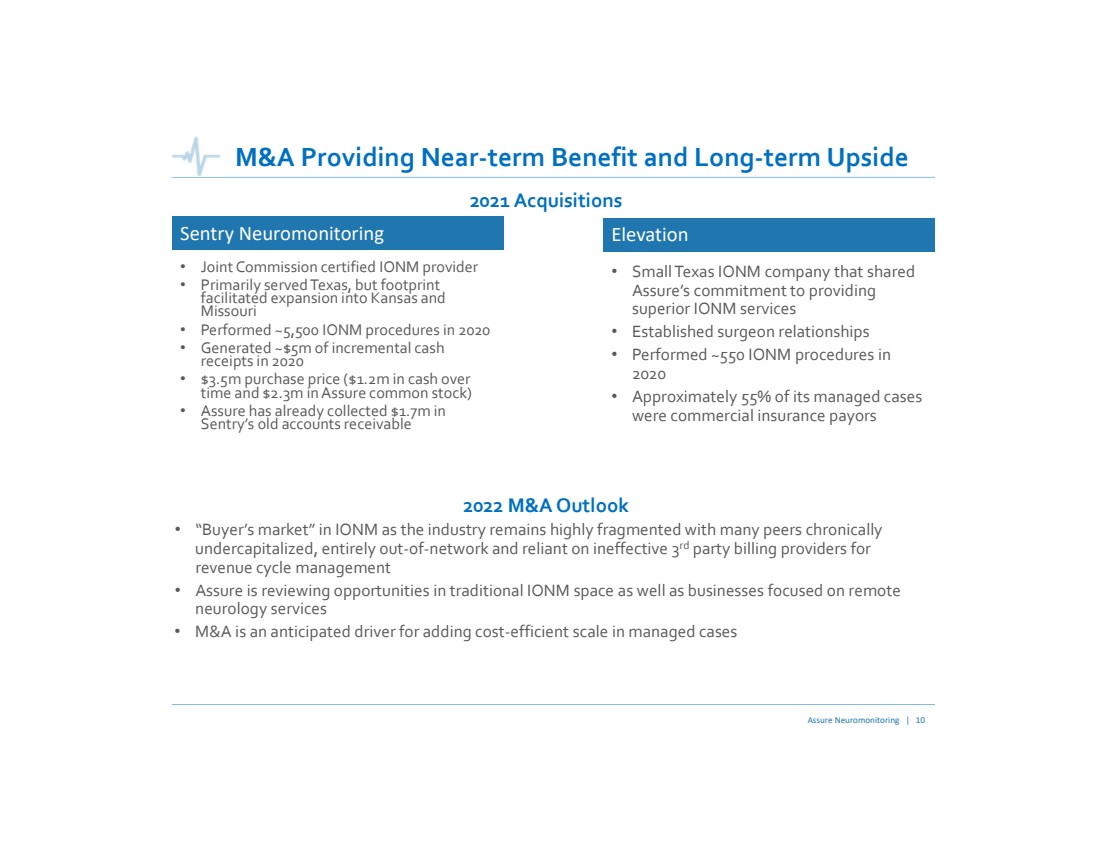
| M&A Providing Near‐term Benefit and Long‐term Upside Assure Neuromonitoring | 10 2021 Acquisitions•Joint Commission certified IONM provider •Primarily served Texas, but footprint facilitated expansion into Kansas and Missouri•Performed ~5,500 IONM procedures in 2020•Generated ~$5m of incremental cash receipts in 2020•$3.5m purchase price ($1.2m in cash over time and $2.3m in Assure common stock)•Assure has already collected $1.7m in Sentry’s old accounts receivable Sentry Neuromonitoring•Small Texas IONM company that shared Assure’s commitment to providing superior IONM services•Established surgeon relationships•Performed ~550 IONM procedures in 2020•Approximately 55% of its managed cases were commercial insurance payors Elevation2022 M&A Outlook•“Buyer’s market” in IONM as the industry remains highly fragmented with many peers chronically undercapitalized, entirely out‐of‐network and reliant on ineffective 3rdparty billing providers for revenue cycle management•Assure is reviewing opportunities in traditional IONM space as well as businesses focused on remote neurology services•M&A is an anticipated driver for adding cost‐efficient scale in managed cases |
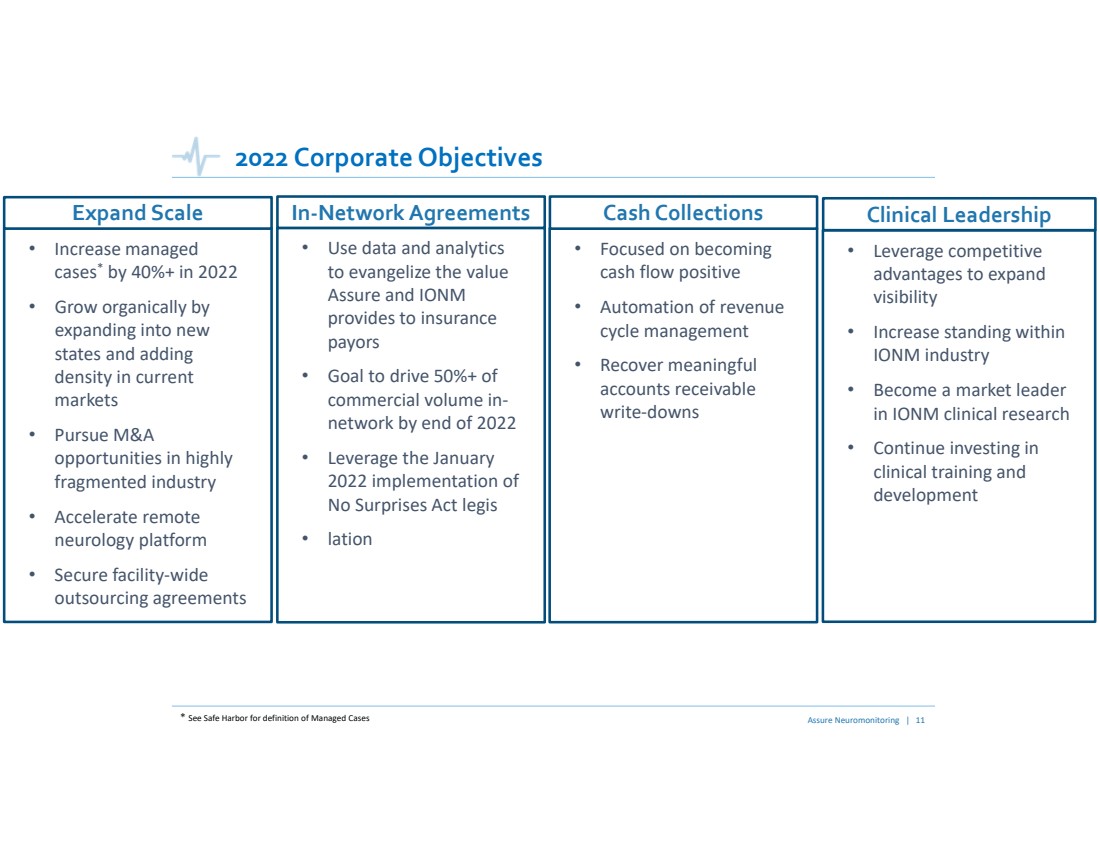
| 2022 Corporate Objectives •Increase managed cases*by 40%+ in 2022 •Grow organically by expanding into new states and adding density in current markets•Pursue M&A opportunities in highly fragmented industry•Accelerate remote neurology platform•Secure facility‐wide outsourcing agreements •Use data and analytics to evangelize the value Assure and IONM provides to insurance payors•Goal to drive 50%+ of commercial volume in‐network by end of 2022•Leverage the January 2022 implementation of No Surprises Act legis•lation •Focused on becoming cash flow positive•Automation of revenue cycle management •Recover meaningful accounts receivable write‐downs Expand Scale Assure Neuromonitoring | 11 In‐Network Agreements Cash Collections •Leverage competitive advantages to expand visibility•Increase standing within IONM industry•Become a market leader in IONM clinical research•Continue investing in clinical training and development Clinical Leadership* See Safe Harbor for definition of Managed Cases |
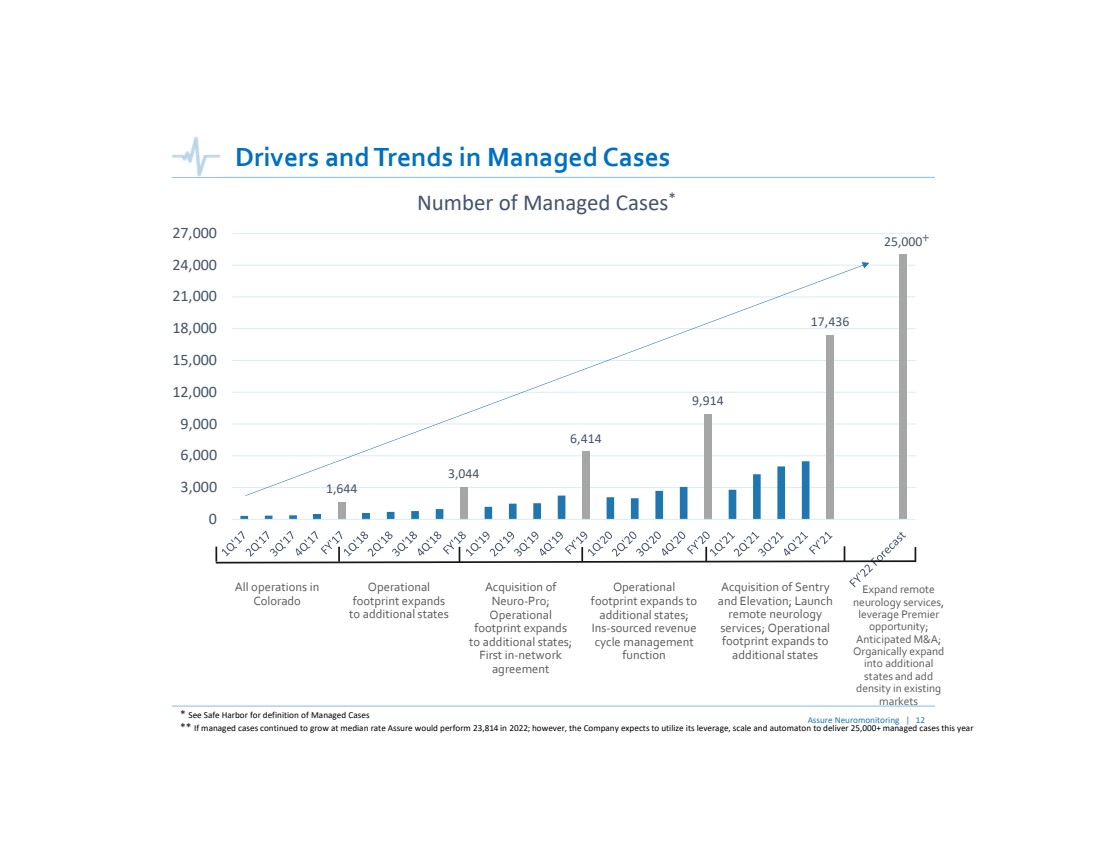
| Assure Neuromonitoring | 12 Drivers and Trends in Managed Cases 1,6443,0446,4149,91417,43625,00003,0006,0009,00012,000 15,00018,00021,000 24,000 27,000 Number of Managed Cases*+* See Safe Harbor for definition of Managed Cases All operations in Colorado Operational footprint expands to additional states Acquisition of Neuro‐Pro; Operational footprint expands to additional states; First in‐network agreement Operational footprint expands to additional states; Ins‐sourced revenue cycle management function Acquisition of Sentry and Elevation; Launch remote neurology services; Operational footprint expands to additional states Expand remote neurology services, leverage Premier opportunity; Anticipated M&A; Organically expand into additional states and add density in existing markets** If managed cases continued to grow at median rate Assure would perform 23,814 in 2022; however, the Company expects to utilize its leverage, scale and automaton to deliver 25,000+ managed cases this year |
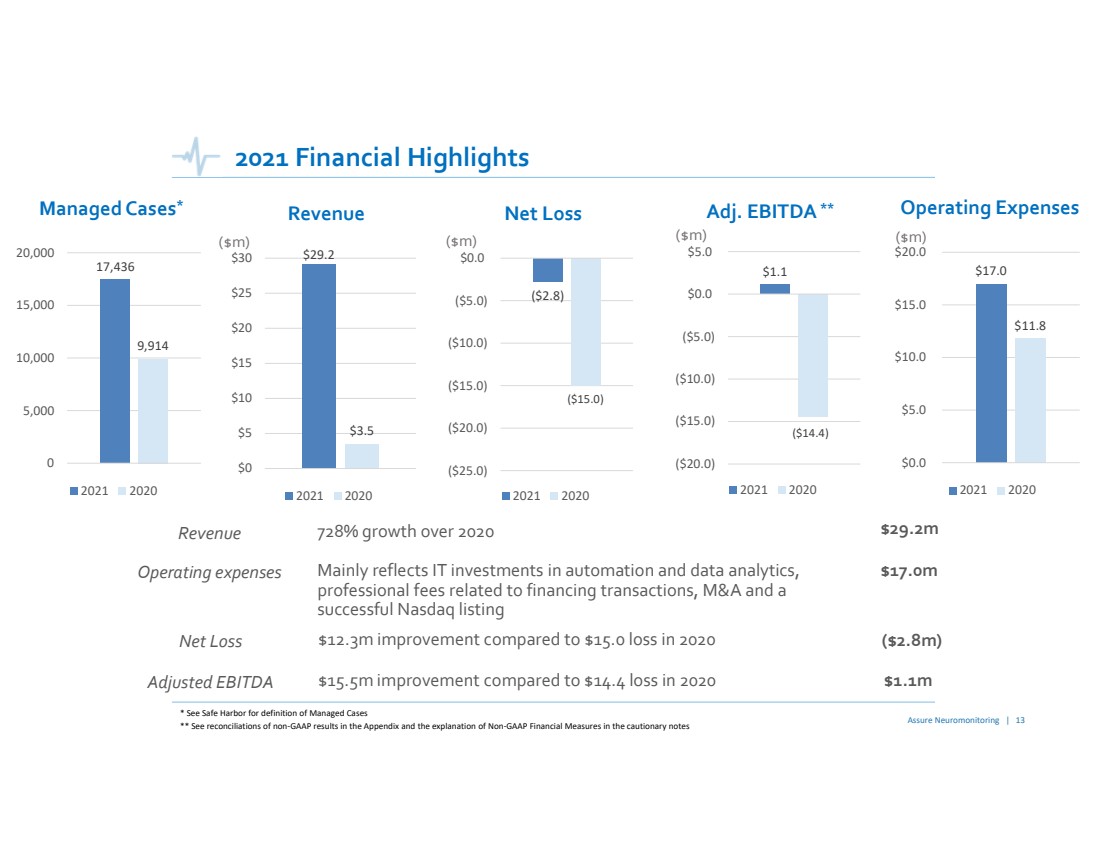
| 2021 Financial Highlights 17,4369,91405,00010,000 15,000 20,000 2021 2020Managed Cases* $29.2$3.5$0$5$10 $15$20$25 $30 2021 2020Revenue $1.1($14.4)($20.0)($15.0)($10.0)($5.0)$0.0$5.0 2021 2020Adj. EBITDA**($m)($m)Assure Neuromonitoring | 13** See reconciliations of non‐GAAP results in the Appendix and the explanation of Non‐GAAP Financial Measures in the cautionary notes* See Safe Harbor for definition of Managed Cases $17.0$11.8$0.0$5.0$10.0 $15.0 $20.0 2021 2020Operating Expenses($m)728% growth over 2020Revenue$29.2mMainly reflects IT investments in automation and data analytics, professional fees related to financing transactions, M&A and a successful Nasdaq listingOperating expenses$17.0m$15.5m improvement compared to $14.4 loss in 2020Adjusted EBITDA$1.1m ($2.8)($15.0)($25.0)($20.0)($15.0)($10.0)($5.0)$0.0 2021 2020Net Loss($m)$12.3m improvement compared to $15.0 loss in 2020Net Loss($2.8m) |
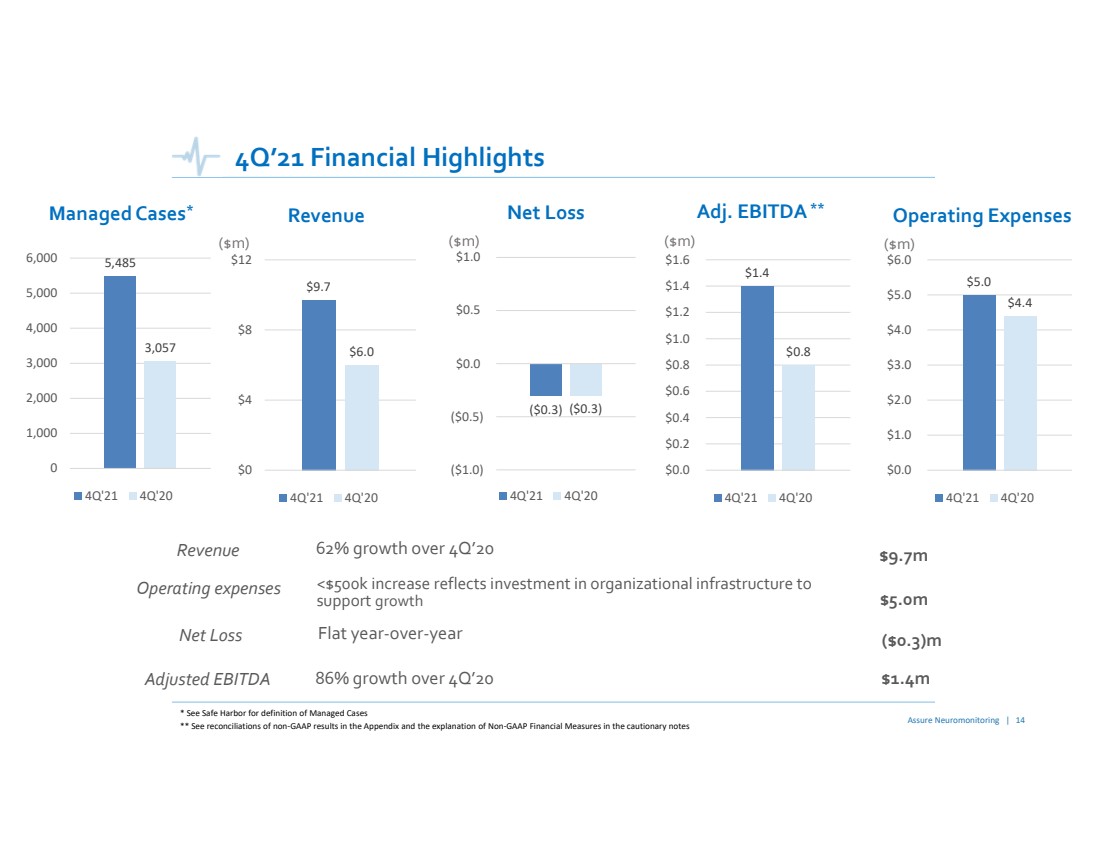
| 4Q’21 Financial Highlights 5,4853,05701,000 2,000 3,0004,0005,000 6,000 4Q'21 4Q'20Managed Cases* $9.7$6.0$0$4$8$12 4Q'21 4Q'20Revenue $1.4$0.8$0.0$0.2 $0.4 $0.6 $0.8 $1.0 $1.2 $1.4 $1.6 4Q'21 4Q'20Adj. EBITDA**($m)($m)Assure Neuromonitoring | 14** See reconciliations of non‐GAAP results in the Appendix and the explanation of Non‐GAAP Financial Measures in the cautionary notes* See Safe Harbor for definition of Managed Cases $5.0$4.4$0.0$1.0 $2.0$3.0$4.0 $5.0 $6.0 4Q'21 4Q'20Operating Expenses($m)62% growth over 4Q’20Revenue$9.7m<$500k increase reflects investment in organizational infrastructure to support growthOperating expenses$5.0m86% growth over 4Q’20Adjusted EBITDA$1.4m ($0.3)($0.3)($1.0)($0.5)$0.0 $0.5 $1.0 4Q'21 4Q'20Net Loss($m)Flat year‐over‐yearNet Loss($0.3)m |
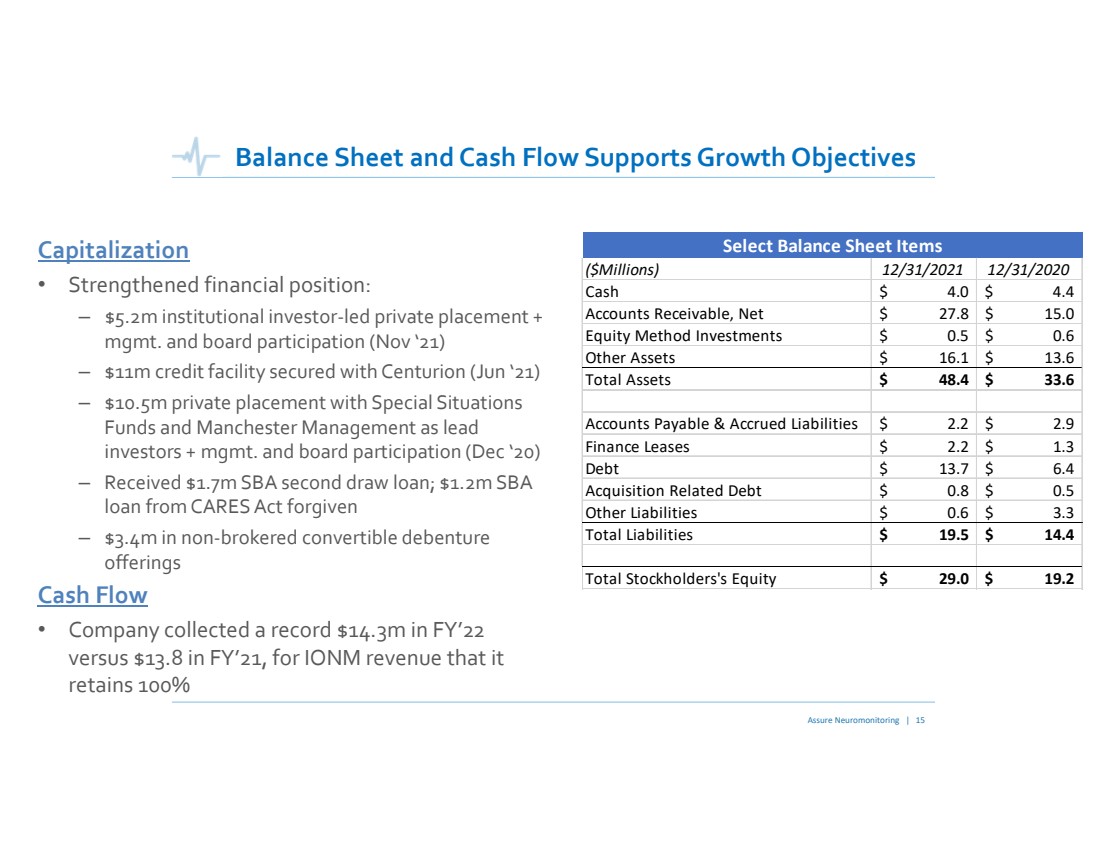
| Balance Sheet and Cash Flow Supports Growth ObjectivesCapitalization •Strengthened financial position: –$5.2m institutional investor‐led private placement + mgmt. and board participation (Nov ‘21)–$11m credit facility secured with Centurion (Jun ‘21)–$10.5m private placement with Special Situations Funds and Manchester Management as lead investors + mgmt. and board participation (Dec ‘20)–Received $1.7m SBA second draw loan; $1.2m SBA loan from CARES Act forgiven–$3.4m in non‐brokered convertible debenture offeringsCash Flow •Company collected a record $14.3m in FY’22 versus $13.8 in FY’21, for IONM revenue that it retains 100% Assure Neuromonitoring | 15 ($Millions)12/31/202112/31/2020Cash4.0$ 4.4$ Accounts Receivable, Net27.8$ 15.0$ Equity Method Investments0.5$ 0.6$ Other Assets16.1$ 13.6$ Total Assets48.4$ 33.6$ Accounts Payable & Accrued Liabilities2.2$ 2.9$ Finance Leases2.2$ 1.3$ Debt13.7$ 6.4$ Acquisition Related Debt0.8$ 0.5$ Other Liabilities0.6$ 3.3$ Total Liabilities19.5$ 14.4$ Total Stockholders's Equity29.0$ 19.2$ Select Balance Sheet Items |
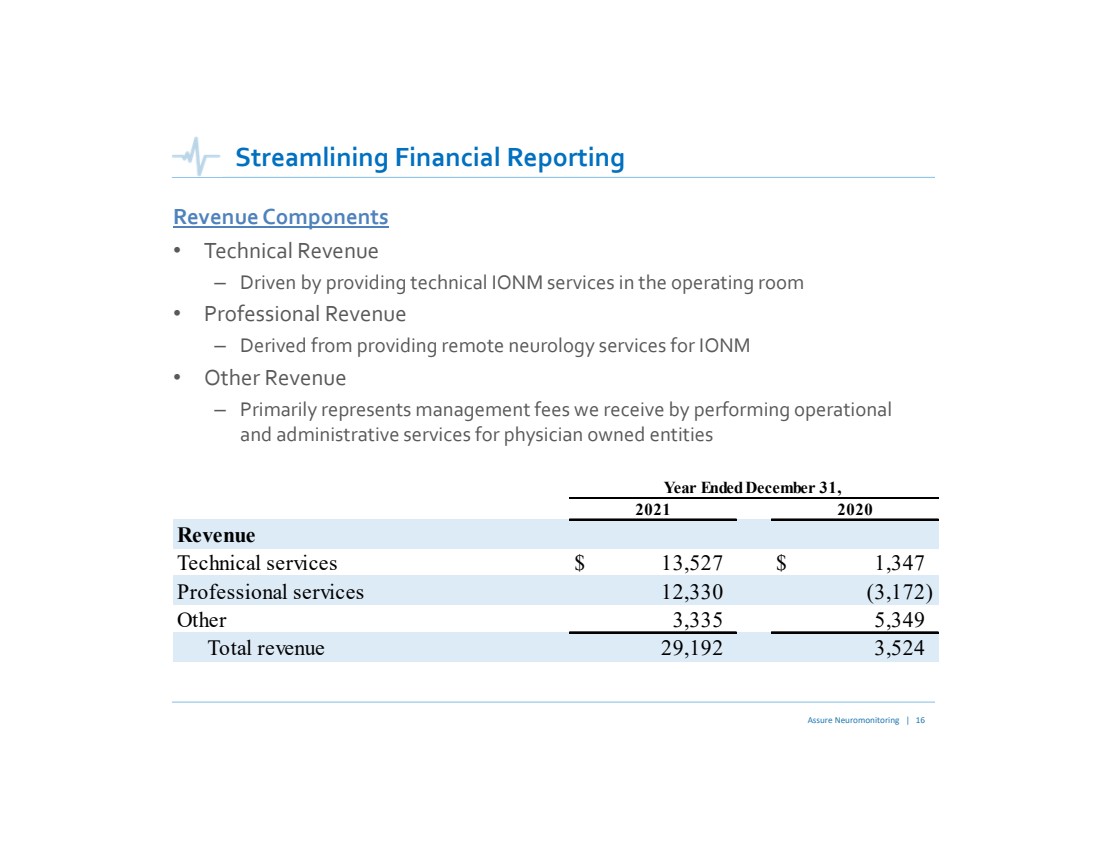
| Streamlining Financial ReportingRevenue Components •Technical Revenue –Driven by providing technical IONM services in the operating room•Professional Revenue –Derived from providing remote neurology services for IONM•Other Revenue–Primarily represents management fees we receive by performing operational and administrative services for physician owned entities Assure Neuromonitoring | 16 Revenue Technical services$13,527 $1,347 Professional services12,330 (3,172) Other 3,335 5,349 Total revenue 29,192 3,524 20212020Year Ended December 31, |
| Q&AAssure Holdings7887 E. Belleview Ave., Suite 500, Englewood, CO(720) 617‐2526www.assureneuromonitoring.com Company ContactJohn FarlingerExecutive Chairman and CEOJohn.Farlinger@assureiom.com Investor RelationsScott KozakDirector, Investor and Media RelationsScott.Kozak@assureiom.com Assure Neuromonitoring | 17 |

| 4Q’21 Earnings Call ‐AppendixMarch 14, 2022 NASDAQ: IONM |
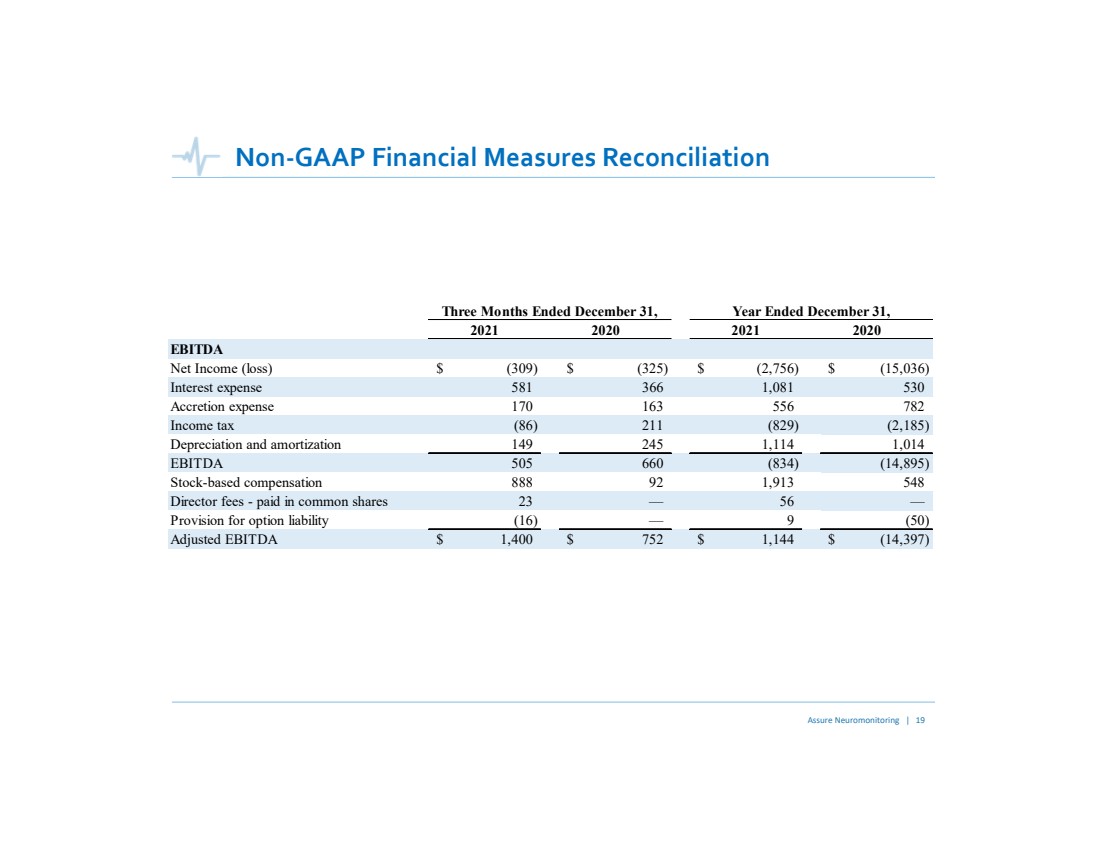
| Non‐GAAP Financial Measures Reconciliation Assure Neuromonitoring | 19 20212021EBITDA Net Income (loss)(309)$ (325)$ (2,756)$ (15,036)$ Interest expense581 366 1,081 530 Accretion expense 170 163 556 782 Income tax (86) 211 (829) (2,185) Depreciation and amortization 149 245 1,114 1,014 EBITDA 505 660 (834) (14,895) Stock-based compensation888 92 1,913 548 Director fees - paid in common shares 23 —56 —Provision for option liability (16) —9 (50) Adjusted EBITDA 1,400$ 752$ 1,144$ (14,397)$ 20202020Three Months Ended December 31,Year Ended December 31, |